White cheese and Greek yogurt with oatmeal

| Parameter | Value | Parameter | Value |
|---|---|---|---|
|
Preparation time
|
12 min |
Number of portions
|
1 |
|
Cena (Walmart)
|
$1.41 |
Cost of one portion
|
$1.41 |
|
Number of ingredients needed for preparation
|
4 |
Total calories
|
522 kcal |
|
Glycemic Index (GI)
|
IG 49 |
Glycemic Load (GL)
|
GL 20.6 |
Ingredients
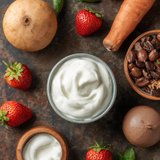
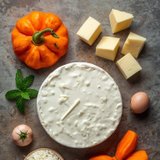
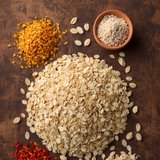

Show Supermarket Price Comparison & Trend
Compare grocery chains & historical meal cost
Supermarket Chain Price Comparator — White cheese and Greek yogurt with oatmeal
Compare estimated shopping costs across major supermarket chains, scale portions or weight, and calculate the route to your nearest store.
| Select supermarket chain | 1 portion | 1 portion | 2 portions | 4 portions | Find store on map & calculate route |
|---|---|---|---|---|---|
Aldi
Cheapest
|
1,28 € | 1,28 € | 2,56 € | 5,12 € | |
Lidl
+2%
|
1,30 € | 1,30 € | 2,60 € | 5,20 € | |
Tesco
+10%
|
1,41 € | 1,41 € | 2,82 € | 5,64 € | |
Carrefour
+13%
|
1,45 € | 1,45 € | 2,90 € | 5,80 € | |
SPAR
+16%
|
1,49 € | 1,49 € | 2,98 € | 5,96 € |
Recipe Summary & Culinary Insights
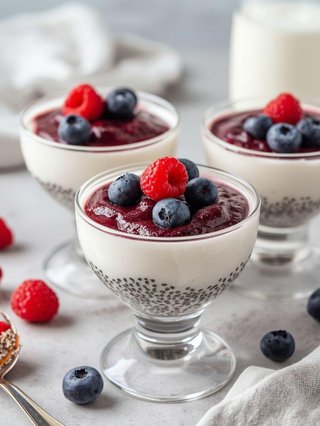
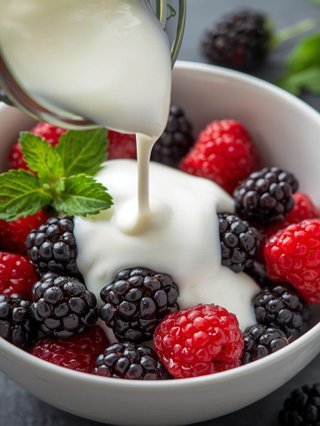
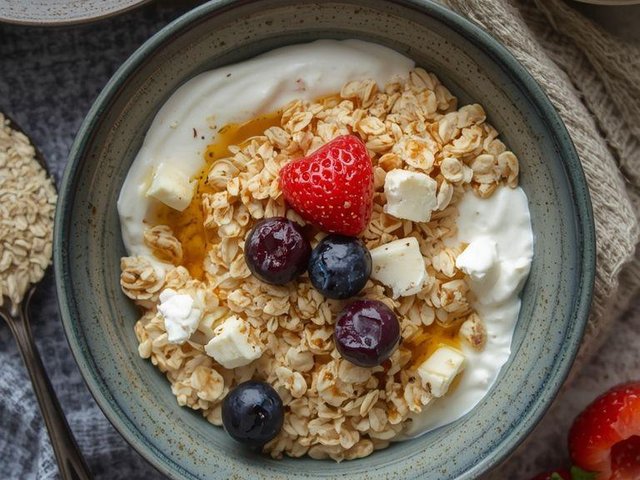
The smooth texture of the white cheese blends beautifully with the creamy consistency of the Greek yogurt, forming a harmonious base. Incorporating the prepared oatmeal introduces a pleasant, slightly resilient texture that contrasts nicely with the velvety cream. The sweet, warm aroma of the honey drizzled over the top completes this culinary masterpiece, ensuring a balanced flavor experience.
From a nutritional perspective, this combination provides an excellent foundation for sustained energy and deep satiety. The proteins from the cheese and yogurt support muscle development, while the complex carbohydrates in the oats ensure a gentle, prolonged release of energy. The composition also promotes digestive comfort and supports gut health.
This dish is perfectly suited as a filling breakfast or as a nutrient-dense snack for an active lifestyle. It fits seamlessly into a vegetarian diet and supports athletes requiring a high intake of protein. It is a simple yet powerful addition to any day, positively influencing metabolic balance.
Recipe preparation steps
Show Full Micronutrient Profile, Allergens & Glucose Curve
Vitamins, minerals, amino acids & glycemic load simulation
Nutrients
Precise micro- and macronutrient analysis with daily reference intake (RDA) coverage (1 portion)
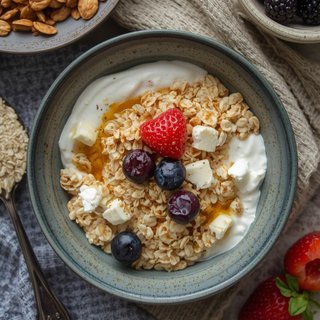
White cheese and Greek yogurt with oatmeal
Alanine
Animal protein
Argentina
Ash
Beta-glucans
Bor
Calcium
Carbohydrates
Carbohydrates, total
Cheese
Chlor
Chlor
Cholesterol
Chromium
Cobalt
Copper
Cysts
Fat
Fat, total
Fiber
Fitosterol
Fluor
Fructose
Galaxy
Glucose
Glutamine
Glycine
Histidine
Insoluble fiber
Inulin
Iodine
Iron
Isoleucine
Lactose
Leucine
Lutein + zeaxanthin
Lysine
Magnesium
Maltose
Manganese
Methionine
Molybdenum
Monounsaturated fatty acids
Omega 3
Omega 6
Oxalic acid
Phenylalanine
Phosphorus
Polyunsaturated fatty acids
Potassium
Proline
Protein
Salt
Saturated fatty acids
Selenium
Sodium
Soluble fiber
Sponge cake
Starch
Sucrose
Sugar
Sulfur
Threonine
Trans fatty acids
Tryptophan
Tyrosine
Valina
Vitamin A
Vitamin B1 (Thiamine)
Vitamin B12 (Cobalamin)
Vitamin B2 (Riboflavin)
Vitamin B3 (Niacin)
Vitamin B5 (Pantothenic acid)
Vitamin B6 (Pyridoxine)
Vitamin B7 (Biotin)
Vitamin B9 (Folic acid)
Vitamin C (Ascorbic acid)
Vitamin D
Vitamin E
Vitamin K
Water
Zinc
| Name | Category | Amount | % RDA |
|---|---|---|---|
| Alanine | - | 0.22 g | - |
| Animal protein | - | 22.44 g | - |
| Argentina | - | 0.3 g | - |
| Ash | - | 4.18 g | - |
| Beta-glucans | - | 1.8 g | - |
| Bor | - | 40 mg | - |
| Calcium | - | 314.9 mg | 39% |
| Carbohydrates | - | 47.31 g | 18% |
| Carbohydrates, total | - | 4.44 g | - |
| Cheese | - | 0.2 g | - |
| Chlor | - | 132.4 mg | - |
| Chlor | - | 46.4 mg | - |
| Cholesterol | - | 32.9 mg | - |
| Chromium | - | 5.2 µg | - |
| Cobalt | - | 0.8 µg | - |
| Copper | - | 0.25 mg | - |
| Cysts | - | 0.1 g | - |
| Fat | - | 17.62 g | 25% |
| Fat, total | - | 5.64 g | - |
| Fiber | - | 5.18 g | 21% |
| Fitosterol | - | 16 mg | - |
| Fluor | - | 4.8 mg | - |
| Fructose | - | 4.13 g | - |
| Galaxy | - | 0.4 g | - |
| Glucose | - | 3.58 g | - |
| Glutamine | - | 1 g | - |
| Glycine | - | 0.2 g | - |
| Histidine | - | 0.09 g | - |
| Insoluble fiber | - | 2.08 g | - |
| Inulin | - | 0.2 g | - |
| Iodine | - | 12 µg | 8% |
| Iron | - | 1.95 mg | 14% |
| Isoleucine | - | 0.16 g | - |
| Lactose | - | 9.04 g | - |
| Leucine | - | 0.32 g | - |
| Lutein + zeaxanthin | - | 72 mg | - |
| Lysine | - | 0.18 g | - |
| Magnesium | - | 82.75 mg | 22% |
| Maltose | - | 0.04 g | - |
| Manganese | - | 1.7 mg | - |
| Methionine | - | 0.07 g | - |
| Molybdenum | - | 12.8 µg | - |
| Monounsaturated fatty acids | - | 5.58 g | - |
| Omega 3 | - | 0.1 g | - |
| Omega 6 | - | 1.1 g | - |
| Oxalic acid | - | 16 mg | - |
| Phenylalanine | - | 0.22 g | - |
| Phosphorus | - | 690.2 mg | 99% |
| Polyunsaturated fatty acids | - | 1.71 g | - |
| Potassium | - | 545.6 mg | 27% |
| Proline | - | 0.28 g | - |
| Protein | - | 43.43 g | 87% |
| Salt | - | 0.29 g | - |
| Saturated fatty acids | - | 9.35 g | - |
| Selenium | - | 35.94 µg | 65% |
| Sodium | - | 115.5 mg | 6% |
| Soluble fiber | - | 0.68 g | - |
| Sponge cake | - | 20 mg | - |
| Starch | - | 23.24 g | - |
| Sucrose | - | 0.49 g | - |
| Sugar | - | 16.93 g | 34% |
| Sulfur | - | 320 mg | - |
| Threonine | - | 0.14 g | - |
| Trans fatty acids | - | 0.52 g | - |
| Tryptophan | - | 0.06 g | - |
| Tyrosine | - | 0.14 g | - |
| Valina | - | 0.22 g | - |
| Vitamin A | - | 79.6 µg | 10% |
| Vitamin B1 (Thiamine) | - | 0.24 mg | - |
| Vitamin B12 (Cobalamin) | - | 2.72 µg | - |
| Vitamin B2 (Riboflavin) | - | 1.1 mg | - |
| Vitamin B3 (Niacin) | - | 0.59 mg | - |
| Vitamin B5 (Pantothenic acid) | - | 1.3 mg | - |
| Vitamin B6 (Pyridoxine) | - | 0.23 mg | - |
| Vitamin B7 (Biotin) | - | 3.6 mg | - |
| Vitamin B9 (Folic acid) | - | 34.6 µg | - |
| Vitamin C (Ascorbic acid) | - | 2.34 mg | - |
| Vitamin D | - | 0.51 µg | 3% |
| Vitamin E | - | 0.82 mg | 7% |
| Vitamin K | - | 1.14 µg | 2% |
| Water | - | 183.67 g | - |
| Zinc | - | 3.29 mg | 33% |
No nutrients matching your search criteria
Nutritional Profile Comparison
📈 Interactive ChartNutrient content comparison per serving
Blood Glucose Curve & Glycemic Index
Biochemical model of blood glucose dynamics (0-180 min) accounting for fat, protein, and fiber buffering.
Blood Glucose Curve (0-180 min)
Biochemical model of blood glucose dynamics (0-180 min) accounting for fat, protein, and fiber buffering.
Glycemic Load (GL) combines both the Glycemic Index (GI) and the actual amount of digestible carbohydrates in a serving.
Clinical thresholds: Low ≤ 10 pts • Moderate 11–19 pts • High ≥ 20 pts