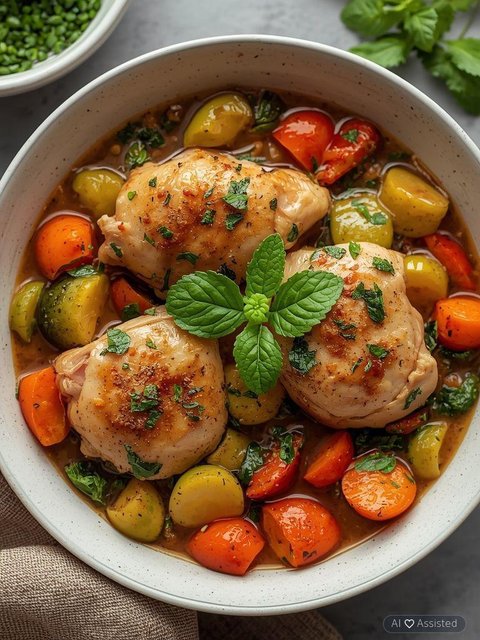
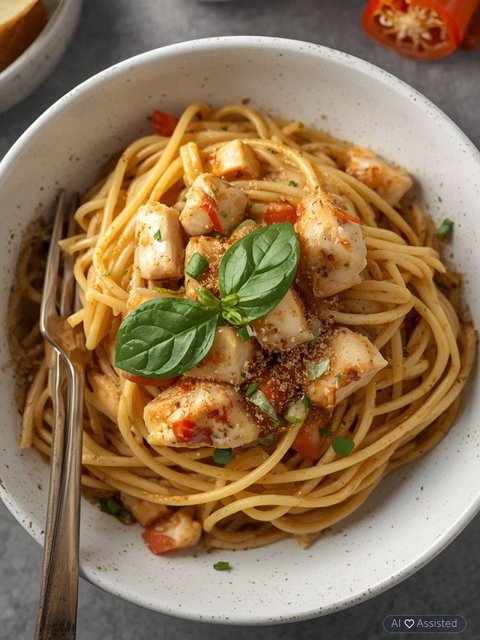
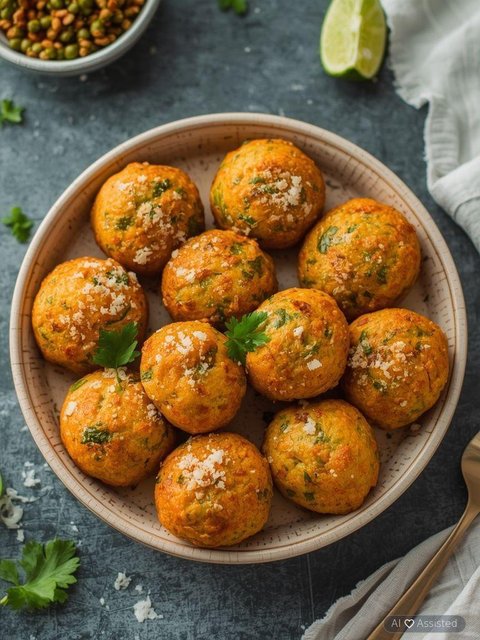
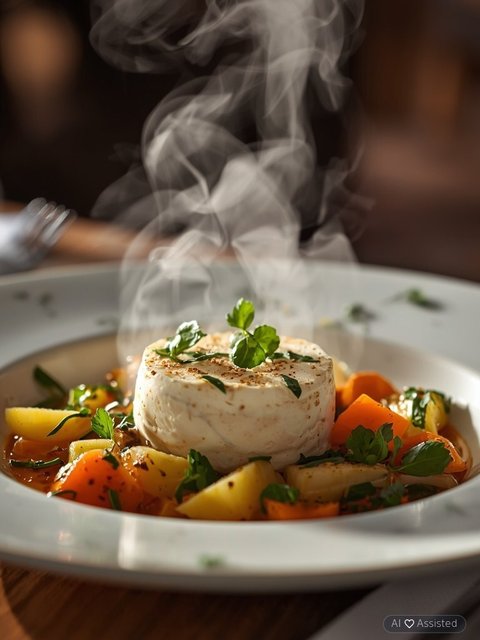
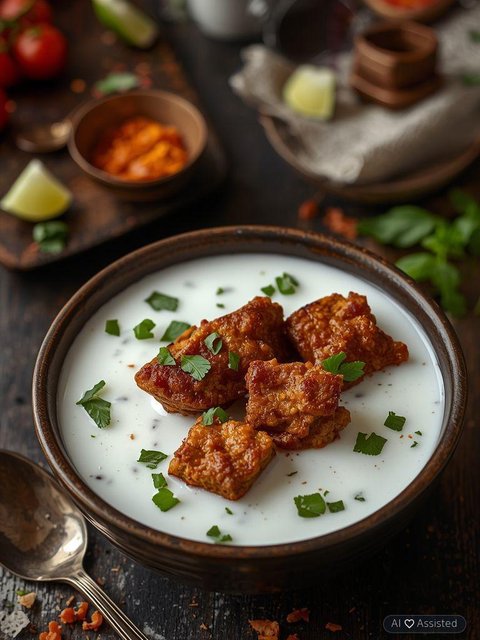
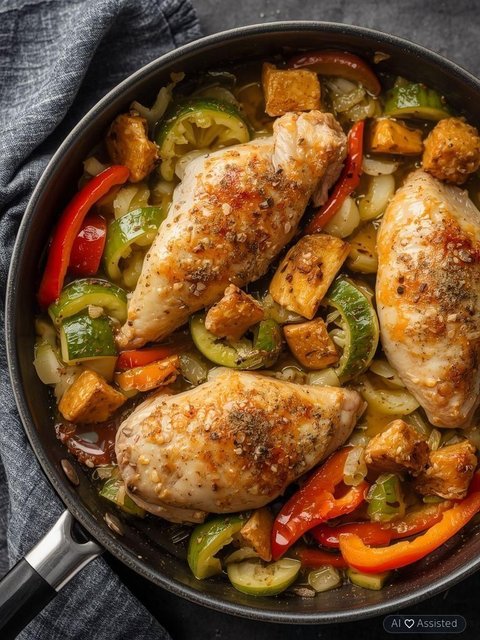
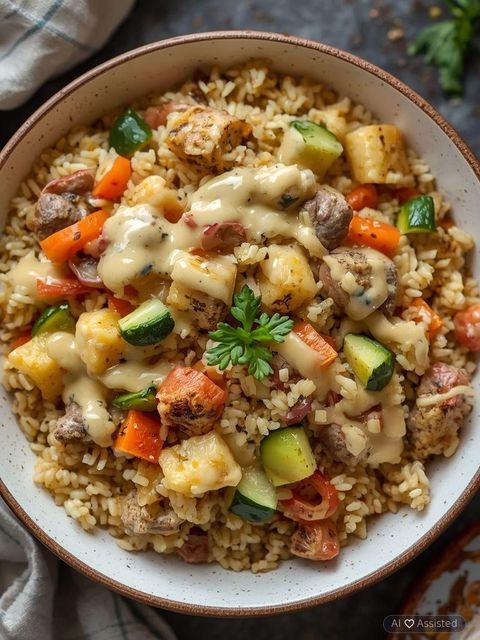
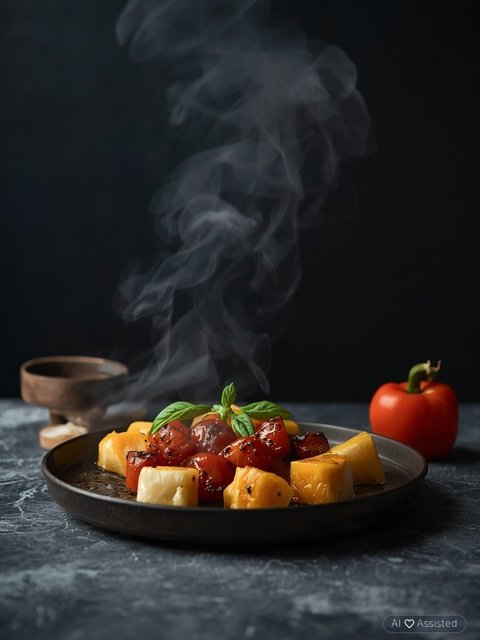
Chicken with Vegetables and Coconut Milk

| Parameter | Value | Parameter | Value |
|---|---|---|---|
|
Preparation time
|
15 min |
Number of portions
|
1 |
|
Cena (Walmart)
|
$4.07 |
Cost of one portion
|
$4.07 |
|
Number of ingredients needed for preparation
|
9 |
Total calories
|
2538 |
|
Calories per 1 portion
|
2538 kcal |
Amount of protein per portion
|
65g |
|
Amount of fat per portion
|
245g |
Amount of carbohydrates per portion
|
18g |
|
Amount of fiber per portion
|
10g |
Glycemic Index (GI)
|
IG 24 |
|
Glycemic Load (GL)
|
GL 1.8 |
Ingredients
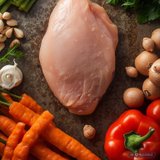

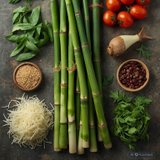
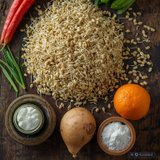

Supermarket Chain Price Comparator — Chicken with Vegetables and Coconut Milk
Compare estimated shopping costs across major supermarket chains, scale portions or weight, and calculate the route to your nearest store.
| Select supermarket chain | 1 portion | 1 portion | 2 portions | 4 portions | Find store on map & calculate route |
|---|---|---|---|---|---|
Aldi
Cheapest
|
3,70 € | 3,70 € | 7,40 € | 14,80 € | |
Lidl
+1%
|
3,74 € | 3,74 € | 7,48 € | 14,96 € | |
Tesco
+10%
|
4,07 € | 4,07 € | 8,14 € | 16,28 € | |
Carrefour
+13%
|
4,19 € | 4,19 € | 8,38 € | 16,76 € | |
SPAR
+16%
|
4,31 € | 4,31 € | 8,62 € | 17,24 € |
Smart Voice
AIWash the chicken breasts thoroughly, cut into small pieces, season with salt and pepper.
Cut the pepper into strips or cubes.
Heat some oil in a pan, add the shoots and beans and fry until soft.
Add the chicken and peppers and continue frying under cover, adding a little water or soy sauce.
Recipe preparation steps
Add coconut milk to the chicken in the same pan. Simmer everything together on low heat until the sauce thickens a bit and the chicken is soft.
Nutrients
Precise micro- and macronutrient analysis with daily reference intake (RDA) coverage (1 portion)

Chicken with Vegetables and Coconut Milk
Alpha Linolenic Acid
Ash
Beta-carotene
Beta-sitosterol
Calcium
Carbohydrate
Chloride
Chlorine
Cholesterol
Copper
Fat
Fatty monounsaturated
Fatty polyunsaturated
Fatty saturated
Fatty trans
Fiber
Fiber insoluble
Fiber soluble
Fructose
Glucose
Iron
Linoleic Acid
Lutein + zeaxanthin
Magnesium
Manganese
Oleic Acid
Omega 3
Omega 6
Palmitic Acid
Phosphorus
Phytosterols
Potassium
Protein
Protein Animal
Protein Plant
Salt
Selenium
Sodium
Stearic Acid
Sucrose
Sugar
Vitamin A
Vitamin B1 (Thiamin)
Vitamin B12 (Cobalamin)
Vitamin B2 (Riboflavin)
Vitamin B3 (Niacin)
Vitamin B5 (Pantothenic acid)
Vitamin B6 (Pyridoxine)
Vitamin B9 (Folate)
Vitamin C (Ascorbic acid)
Vitamin D
Vitamin E
Vitamin K
Water
Zinc
| Name | Category | Amount | % RDA |
|---|---|---|---|
| Alpha Linolenic Acid | - | 0.08 g | - |
| Ash | - | 6.17 g | - |
| Beta-carotene | - | 1261.5 µg | - |
| Beta-sitosterol | - | 14.3 mg | - |
| Calcium | - | 55.31 mg | 7% |
| Carbohydrate | - | 17.66 g | 7% |
| Chloride | - | 69.5 mg | - |
| Chlorine | - | 3 mg | - |
| Cholesterol | - | 388.72 mg | - |
| Copper | - | 0.38 mg | - |
| Fat | - | 245.11 g | 350% |
| Fatty monounsaturated | - | 112.73 g | - |
| Fatty polyunsaturated | - | 28.37 g | - |
| Fatty saturated | - | 93.41 g | - |
| Fatty trans | - | 0.73 g | - |
| Fiber | - | 10.27 g | 41% |
| Fiber insoluble | - | 2.5 g | - |
| Fiber soluble | - | 1.4 g | - |
| Fructose | - | 2.58 g | - |
| Glucose | - | 2.1 g | - |
| Iron | - | 3.09 mg | 22% |
| Linoleic Acid | - | 0.98 g | - |
| Lutein + zeaxanthin | - | 52.5 mg | - |
| Magnesium | - | 94.95 mg | 25% |
| Manganese | - | 0.31 mg | - |
| Oleic Acid | - | 7 g | - |
| Omega 3 | - | 2.48 g | - |
| Omega 6 | - | 25.92 g | - |
| Palmitic Acid | - | 1.35 g | - |
| Phosphorus | - | 585.64 mg | 84% |
| Phytosterols | - | 22 mg | - |
| Potassium | - | 1245.26 mg | 62% |
| Protein | - | 65.25 g | 131% |
| Protein Animal | - | 58.8 g | - |
| Protein Plant | - | 1.8 g | - |
| Salt | - | 102.34 g | - |
| Selenium | - | 74.39 µg | 135% |
| Sodium | - | 244.55 mg | 12% |
| Stearic Acid | - | 0.23 g | - |
| Sucrose | - | 0.22 g | - |
| Sugar | - | 13.5 g | 27% |
| Vitamin A | - | 386.5 µg | 48% |
| Vitamin B1 (Thiamin) | - | 0.47 mg | - |
| Vitamin B12 (Cobalamin) | - | 1.17 µg | - |
| Vitamin B2 (Riboflavin) | - | 0.53 mg | - |
| Vitamin B3 (Niacin) | - | 41.8 mg | - |
| Vitamin B5 (Pantothenic acid) | - | 4.37 mg | - |
| Vitamin B6 (Pyridoxine) | - | 2.26 mg | - |
| Vitamin B9 (Folate) | - | 85.87 µg | - |
| Vitamin C (Ascorbic acid) | - | 145.66 mg | - |
| Vitamin D | - | 0.1 µg | 1% |
| Vitamin E | - | 9 mg | 75% |
| Vitamin K | - | 43.41 µg | 58% |
| Water | - | 403.82 g | - |
| Zinc | - | 2.97 mg | 30% |
No nutrients matching your search criteria
Nutritional Profile Comparison
📈 Interactive ChartNutrient content comparison per serving
Blood Glucose Curve & Glycemic Index
Biochemical model of blood glucose dynamics (0-180 min) accounting for fat, protein, and fiber buffering.
Blood Glucose Curve (0-180 min)
Biochemical model of blood glucose dynamics (0-180 min) accounting for fat, protein, and fiber buffering.
Glycemic Load (GL) combines both the Glycemic Index (GI) and the actual amount of digestible carbohydrates in a serving.
Clinical thresholds: Low ≤ 10 pts • Moderate 11–19 pts • High ≥ 20 pts