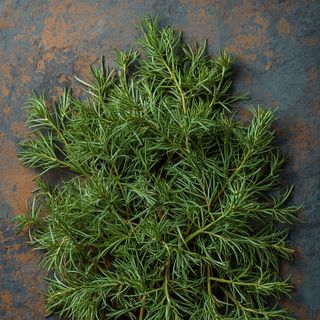

1 photo
1754
store.comparator.pro_badge
Store Prices
store.comparator.title — Dried Dill
store.comparator.subtitle
store.comparator.cheapest_label
Biedronka
0,16 USD
/ 100 g
store.comparator.select_store
store.comparator.unlock_desc
store.comparator.price_for_product:
store.comparator.price_for_product
(100 g)
0,16 USD
100 kcal
0,41 USD
20 g protein
1,14 USD
| store.comparator.select_store | 100 g | 250 g | 500 g | 1 kg | store.finder.open_btn |
|---|---|---|---|---|---|
|
Biedronka
store.comparator.cheapest_label
|
0,16 USD | 0,40 USD | 0,80 USD | 1,60 USD | |
|
Dino
|
0,16 USD | 0,40 USD | 0,80 USD | 1,60 USD | |
|
Kaufland
|
0,16 USD | 0,40 USD | 0,80 USD | 1,60 USD | |
|
Netto
|
0,16 USD | 0,40 USD | 0,80 USD | 1,60 USD | |
|
Auchan
|
0,16 USD | 0,40 USD | 0,80 USD | 1,60 USD | |
|
Aldi
|
0,16 USD | 0,40 USD | 0,80 USD | 1,60 USD | |
|
Trader Joe's
+6%
|
0,17 USD | 0,43 USD | 0,85 USD | 1,70 USD | |
|
Carrefour
+6%
|
0,17 USD | 0,43 USD | 0,85 USD | 1,70 USD | |
|
Rewe
+6%
|
0,17 USD | 0,43 USD | 0,85 USD | 1,70 USD | |
|
Edeka
+6%
|
0,17 USD | 0,43 USD | 0,85 USD | 1,70 USD | |
|
Walmart
+6%
|
0,17 USD | 0,43 USD | 0,85 USD | 1,70 USD | |
|
Target
+6%
|
0,17 USD | 0,43 USD | 0,85 USD | 1,70 USD | |
|
Lidl
+6%
|
0,17 USD | 0,43 USD | 0,85 USD | 1,70 USD | |
|
Żabka
+25%
|
0,20 USD | 0,50 USD | 1,00 USD | 2,00 USD |
Smart Voice
•Listen to the article content live
0:00
/
0:00
Contains allergens
3
Nutritional Profile & Bioactivity
Nutrients
Precise micro- and macronutrient analysis with daily reference intake (RDA) coverage (100g)
Macronutrient Distribution
100g
39
kcal
Protein
2.8g
Fat
0.4g
Carbs
6.1g

Bio-Analysis
Food Product
Dried Dill
39 kcal
B: 2.8g
T: 0.4g
W: 6.1g
🔍
Looking for a specific mineral or vitamin?
Explore all 24 nutrients organized by category and RDA coverage.
Nutrient
8% RDA
Calcium
64
mg
Nutrient
2% RDA
Carbohydrate
6.1
g
Nutrient
Copper
0.12
mg
Nutrient
1% RDA
Fat
0.4
g
Nutrient
Fatty monounsaturated
0.1
g
Nutrient
Fatty polyunsaturated
0.2
g
Nutrient
Fatty saturated
0.1
g
Nutrient
13% RDA
Fiber
3.3
g
Nutrient
19% RDA
Iron
2.7
mg
Nutrient
4% RDA
Magnesium
14
mg
Nutrient
Manganese
0.5
mg
Nutrient
7% RDA
Phosphorus
51
mg
Nutrient
20% RDA
Potassium
396
mg
Nutrient
6% RDA
Protein
2.8
g
Nutrient
Sodium
7
mg
Nutrient
Sucrose
0.1
g
Nutrient
44% RDA
Vitamin A
350
µg
Nutrient
Vitamin B1 (Thiamin)
0.23
mg
Nutrient
Vitamin B2 (Riboflavin)
0.11
mg
Nutrient
Vitamin B3 (Niacin)
0.2
mg
Nutrient
Vitamin B6 (Pyridoxine)
0.1
mg
Nutrient
Vitamin C (Ascorbic acid)
31
mg
Nutrient
2% RDA
Vitamin E
0.2
mg
Nutrient
26% RDA
Zinc
2.6
mg
| Name | Category | Amount | % RDA |
|---|---|---|---|
| Calcium | - | 64 mg | 8% |
| Carbohydrate | - | 6.1 g | 2% |
| Copper | - | 0.12 mg | - |
| Fat | - | 0.4 g | 1% |
| Fatty monounsaturated | - | 0.1 g | - |
| Fatty polyunsaturated | - | 0.2 g | - |
| Fatty saturated | - | 0.1 g | - |
| Fiber | - | 3.3 g | 13% |
| Iron | - | 2.7 mg | 19% |
| Magnesium | - | 14 mg | 4% |
| Manganese | - | 0.5 mg | - |
| Phosphorus | - | 51 mg | 7% |
| Potassium | - | 396 mg | 20% |
| Protein | - | 2.8 g | 6% |
| Sodium | - | 7 mg | - |
| Sucrose | - | 0.1 g | - |
| Vitamin A | - | 350 µg | 44% |
| Vitamin B1 (Thiamin) | - | 0.23 mg | - |
| Vitamin B2 (Riboflavin) | - | 0.11 mg | - |
| Vitamin B3 (Niacin) | - | 0.2 mg | - |
| Vitamin B6 (Pyridoxine) | - | 0.1 mg | - |
| Vitamin C (Ascorbic acid) | - | 31 mg | - |
| Vitamin E | - | 0.2 mg | 2% |
| Zinc | - | 2.6 mg | 26% |
No nutrients matching your search criteria
Nutritional Profile Comparison
📈 Interactive ChartNutrient content comparison per serving
bio_analysis.chart.toggle_series:
bio_analysis.chart.time_horizon:
bio_analysis.glucose.clinical_insight_title
bio_analysis.glucose.insight_low_gl
bio_analysis.glucose.gl_title
Low
0.3
bio_analysis.glucose.points_unit
bio_analysis.edu.gl_explanation
bio_analysis.edu.gl_thresholds
bio_analysis.glucose.gi_short
5
bio_analysis.glucose.peak_short
92
mg/dL
bio_analysis.glucose.buffer_short
0.52
🛡️ bio_analysis.edu.why_peak_matters
bio_analysis.edu.buffer_explanation
bio_analysis.glucose.net_carbs_label
6.1 g
bio_analysis.glucose.sugars_simple: 1.1 g
bio_analysis.glucose.fiber_slowing: 0 g