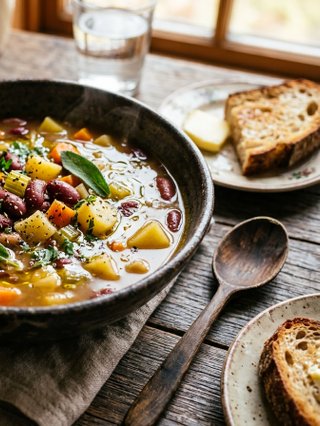
Aromatic Tuscan tomato cream with crispy vegetables and basil
| Parameter | Value | Parameter | Value |
|---|---|---|---|
|
Preparation time
|
25 min |
Number of portions
|
2 |
|
Cena (Walmart)
|
$4.24 |
Cost of one portion
|
$2.12 |
|
Number of ingredients needed for preparation
|
8 |
Total calories
|
382 kcal |
|
Glycemic Index (GI)
|
IG 24 |
Glycemic Load (GL)
|
GL 2.7 |
Ingredients


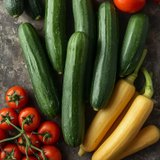
Skinless tomatoes (fresh or canned whole peeled)
#Vegetarian #Vegetarian #Gluten-free #Lactose-Free #Low-carbohydrate



Show Supermarket Price Comparison & Trend
Compare grocery chains & historical meal cost
Supermarket Chain Price Comparator — Aromatic Tuscan tomato cream with crispy vegetables and basil
Compare estimated shopping costs across major supermarket chains, scale portions or weight, and calculate the route to your nearest store.
| Select supermarket chain | 1 portion | 1 portion | 2 portions | 4 portions | Find store on map & calculate route |
|---|---|---|---|---|---|
Aldi
Cheapest
|
1,93 € | 1,93 € | 3,86 € | 7,72 € | |
Lidl
+1%
|
1,95 € | 1,95 € | 3,90 € | 7,80 € | |
Tesco
+10%
|
2,12 € | 2,12 € | 4,24 € | 8,48 € | |
Carrefour
+13%
|
2,18 € | 2,18 € | 4,36 € | 8,72 € | |
SPAR
+17%
|
2,25 € | 2,25 € | 4,50 € | 9,00 € |
Recipe Summary & Culinary Insights
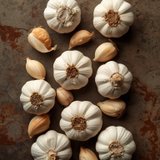
This aromatic Tuscan Tomato Cream Soup unites the deep, sweet notes of ripe tomatoes with the earthy depth of carrot, celeriac, and parsley root. The gently simmered base, enriched with garlic and fragrant basil, forms a velvety, rich core. The texture is perfected by the smooth emulsion of the soup and the contrast provided by the finely diced bell pepper and cucumber, creating a harmonious flavor experience.
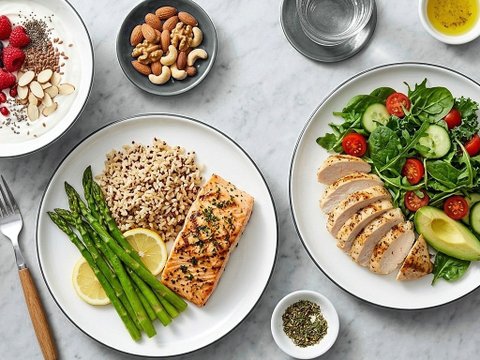
The composition of this dish supports the body through a balanced provision of essential nutrients. It promotes steady energy release over an extended period and contributes to a profound feeling of satiety due to its high fiber content. The components also aid in digestive comfort and help naturally regulate metabolic balance.
The preparation is an act of care, resulting in a warm, comforting meal. This soup serves wonderfully as a satisfying lunch or supper and fits perfectly into a lifestyle focused on nutrient-dense, easily digestible, and high-fiber fare. It is a marvelous addition to a gluten-free and lactose-free dietary pattern.
Recipe preparation steps
Show Full Micronutrient Profile, Allergens & Glucose Curve
Vitamins, minerals, amino acids & glycemic load simulation
Nutrients
Precise micro- and macronutrient analysis with daily reference intake (RDA) coverage (1 portion)

Aromatic Tuscan tomato cream with crispy vegetables and basil
ARE vitamin
Added sugar
Alcohol
Argentina
Ash
Baking soda
Bor
Calcium
Carbohydrates
Carotene Beta
Chlor
Chlor
Cholesterol
Chromium
Citric acid
Cobalt
Copper
Fat
Fiber
Fitosterol
Fluor
Fructose
Glucose
Glutamine
Insoluble fiber
Inulin
Iodine
Iron
Lutein + zeaxanthin
Lysine
Magnesium
Manganese
Molybdenum
Monounsaturated fatty acids
Nickel
Omega 3
Omega 6
Oxalic acid
Phosphorus
Polyunsaturated fatty acids
Potassium
Protein
Salt
Saturated fatty acids
Selenium
Sodium
Soluble fiber
Sponge cake
Starch
Sucrose
Sugar
Sulfur
Theobromine
Total sugar alcohol
Trans fatty acids
Vitamin A
Vitamin B1 (Thiamine)
Vitamin B12 (Cobalamin)
Vitamin B2 (Riboflavin)
Vitamin B3 (Niacin)
Vitamin B5 (Pantothenic acid)
Vitamin B6 (Pyridoxine)
Vitamin B7 (Biotin)
Vitamin B9 (Folic acid)
Vitamin C (Ascorbic acid)
Vitamin D
Vitamin E
Vitamin K
Water
Zinc
| Name | Category | Amount | % RDA |
|---|---|---|---|
| ARE vitamin | - | 11.1 µg | - |
| Added sugar | - | 0.3 g | - |
| Alcohol | - | 0.3 g | - |
| Argentina | - | 0.03 g | - |
| Ash | - | 0.2 g | - |
| Baking soda | - | 0.27 g | - |
| Bor | - | 15 mg | - |
| Calcium | - | 13.55 mg | 2% |
| Carbohydrates | - | 16.17 g | 6% |
| Carotene Beta | - | 66.6 mg | - |
| Chlor | - | 11.1 mg | - |
| Chlor | - | 11.1 mg | - |
| Cholesterol | - | 0.35 mg | - |
| Chromium | - | 0.21 µg | - |
| Citric acid | - | 3 mg | - |
| Cobalt | - | 0.03 µg | - |
| Copper | - | 0.03 mg | - |
| Fat | - | 11.1 g | 16% |
| Fiber | - | 5.03 g | 20% |
| Fitosterol | - | 2.1 mg | - |
| Fluor | - | 0.39 mg | - |
| Fructose | - | 0.29 g | - |
| Glucose | - | 0.26 g | - |
| Glutamine | - | 0.08 g | - |
| Insoluble fiber | - | 0.29 g | - |
| Inulin | - | 0.6 g | - |
| Iodine | - | 0.87 µg | 1% |
| Iron | - | 0.15 mg | 1% |
| Lutein + zeaxanthin | - | 6 mg | - |
| Lysine | - | 0.02 g | - |
| Magnesium | - | 4.25 mg | 1% |
| Manganese | - | 0.11 mg | - |
| Molybdenum | - | 0.3 µg | - |
| Monounsaturated fatty acids | - | 0.01 g | - |
| Nickel | - | 0.3 mg | - |
| Omega 3 | - | 0.01 g | - |
| Omega 6 | - | 0.02 g | - |
| Oxalic acid | - | 0.6 mg | - |
| Phosphorus | - | 13.05 mg | 2% |
| Polyunsaturated fatty acids | - | 0.03 g | - |
| Potassium | - | 64.1 mg | 3% |
| Protein | - | 6.58 g | 13% |
| Salt | - | 0.28 g | - |
| Saturated fatty acids | - | 0.02 g | - |
| Selenium | - | 0.8 µg | 2% |
| Sodium | - | 1.45 mg | - |
| Soluble fiber | - | 0.07 g | - |
| Sponge cake | - | 30 mg | - |
| Starch | - | 1.58 g | - |
| Sucrose | - | 0.09 g | - |
| Sugar | - | 0.62 g | 1% |
| Sulfur | - | 6 mg | - |
| Theobromine | - | 0.3 mg | - |
| Total sugar alcohol | - | 0.3 g | - |
| Trans fatty acids | - | 0.35 g | - |
| Vitamin A | - | 5.7 µg | 1% |
| Vitamin B1 (Thiamine) | - | 0.02 mg | - |
| Vitamin B12 (Cobalamin) | - | 0.3 µg | - |
| Vitamin B2 (Riboflavin) | - | 0.01 mg | - |
| Vitamin B3 (Niacin) | - | 0.1 mg | - |
| Vitamin B5 (Pantothenic acid) | - | 0.09 mg | - |
| Vitamin B6 (Pyridoxine) | - | 0.07 mg | - |
| Vitamin B7 (Biotin) | - | 0.06 mg | - |
| Vitamin B9 (Folic acid) | - | 2.82 µg | - |
| Vitamin C (Ascorbic acid) | - | 4.31 mg | - |
| Vitamin D | - | 0.35 µg | 2% |
| Vitamin E | - | 0.03 mg | - |
| Vitamin K | - | 42.03 µg | 56% |
| Water | - | 31.73 g | - |
| Zinc | - | 0.08 mg | 1% |
No nutrients matching your search criteria
Nutritional Profile Comparison
📈 Interactive ChartNutrient content comparison per serving
Blood Glucose Curve & Glycemic Index
Biochemical model of blood glucose dynamics (0-180 min) accounting for fat, protein, and fiber buffering.
Blood Glucose Curve (0-180 min)
Biochemical model of blood glucose dynamics (0-180 min) accounting for fat, protein, and fiber buffering.
Glycemic Load (GL) combines both the Glycemic Index (GI) and the actual amount of digestible carbohydrates in a serving.
Clinical thresholds: Low ≤ 10 pts • Moderate 11–19 pts • High ≥ 20 pts