Cocoa Butter 2
| Parameter | Value | Parameter | Value |
|---|---|---|---|
|
Calories / 100g
|
894 kcal (3680 kJ) |
Protein / 100g
|
0,8 g |
|
Fat / 100g
|
99,0 g |
Carbs / 100g
|
1,0 g |
|
Fiber / 100g
|
0,0 g |
Glycemic Index (GI)
|
IG 0 |
|
Glycemic Load (GL)
|
GL 0.6 |
Cena / 100g (Walmart)
|
$0.98 |
|
Woda / 100g
|
0,1 g |
Supermarket Chain Price Comparator — Cocoa Butter 2
Compare estimated shopping costs across major supermarket chains, scale portions or weight, and calculate the route to your nearest store.
| Select supermarket chain | 100 g | 100 g | 250 g | 500 g | 1 kg | Find store on map & calculate route |
|---|---|---|---|---|---|---|
Auchan
Cheapest
|
0,92 USD | 0,92 USD | 2,30 USD | 4,60 USD | 9,20 USD | |
Netto
+1%
|
0,93 USD | 0,93 USD | 2,33 USD | 4,65 USD | 9,30 USD | |
Biedronka
+2%
|
0,94 USD | 0,94 USD | 2,35 USD | 4,70 USD | 9,40 USD | |
Aldi
+3%
|
0,95 USD | 0,95 USD | 2,38 USD | 4,75 USD | 9,50 USD | |
Dino
+3%
|
0,95 USD | 0,95 USD | 2,38 USD | 4,75 USD | 9,50 USD | |
Kaufland
+3%
|
0,95 USD | 0,95 USD | 2,38 USD | 4,75 USD | 9,50 USD | |
Lidl
+4%
|
0,96 USD | 0,96 USD | 2,40 USD | 4,80 USD | 9,60 USD | |
Rewe
+4%
|
0,96 USD | 0,96 USD | 2,40 USD | 4,80 USD | 9,60 USD | |
Carrefour
+8%
|
0,99 USD | 0,99 USD | 2,48 USD | 4,95 USD | 9,90 USD | |
Żabka
+23%
|
1,13 USD | 1,13 USD | 2,82 USD | 5,65 USD | 11,30 USD |
Smart Voice
AINutrients
Precise micro- and macronutrient analysis with daily reference intake (RDA) coverage (100 g)

Cocoa Butter 2
Alpha Linolenic Acid
Ash
Calcium
Carbohydrate
Chlorine
Cholesterol
Copper
Fat
Fatty monounsaturated
Fatty polyunsaturated
Fatty saturated
Fatty trans
Fiber
Iron
Linoleic Acid
Magnesium
Manganese
Natron
Oleic Acid
Omega 3
Omega 6
Palmitic Acid
Phosphorus
Phytosterols
Potassium
Protein
Sodium
Stearic Acid
Sugar
Vitamin B3 (Niacin)
Vitamin B6 (Pyridoxine)
Vitamin B9 (Folate)
Vitamin E
Vitamin K
Water
Zinc
| Name | Category | Amount | % RDA |
|---|---|---|---|
| Alpha Linolenic Acid | - | 0.01 g | - |
| Ash | - | 0.1 g | - |
| Calcium | - | 2 mg | - |
| Carbohydrate | - | 1 g | - |
| Chlorine | - | 100 mg | - |
| Cholesterol | - | 1 mg | - |
| Copper | - | 0.05 mg | - |
| Fat | - | 99 g | 141% |
| Fatty monounsaturated | - | 5.2 g | - |
| Fatty polyunsaturated | - | 1.3 g | - |
| Fatty saturated | - | 83.7 g | - |
| Fatty trans | - | 1 g | - |
| Fiber | - | 1 g | 4% |
| Iron | - | 0.2 mg | 1% |
| Linoleic Acid | - | 1.25 g | - |
| Magnesium | - | 200 mg | 53% |
| Manganese | - | 0.01 mg | - |
| Natron | - | 2 g | - |
| Oleic Acid | - | 5.2 g | - |
| Omega 3 | - | 0.01 g | - |
| Omega 6 | - | 1.25 g | - |
| Palmitic Acid | - | 25 g | - |
| Phosphorus | - | 1 mg | - |
| Phytosterols | - | 150 mg | - |
| Potassium | - | 10 mg | 1% |
| Protein | - | 0.8 g | 2% |
| Sodium | - | 1 mg | - |
| Stearic Acid | - | 33 g | - |
| Sugar | - | 1 g | 2% |
| Vitamin B3 (Niacin) | - | 0.01 mg | - |
| Vitamin B6 (Pyridoxine) | - | 0.01 mg | - |
| Vitamin B9 (Folate) | - | 1 µg | - |
| Vitamin E | - | 1.8 mg | 15% |
| Vitamin K | - | 2 µg | 3% |
| Water | - | 0.1 g | - |
| Zinc | - | 0.1 mg | 1% |
No nutrients matching your search criteria
Nutritional Profile Comparison
📈 Interactive ChartNutrient content comparison per serving
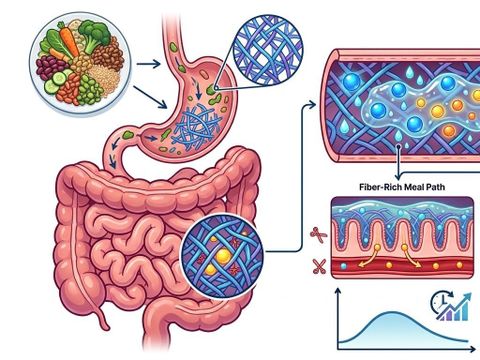
Blood Glucose Curve & Glycemic Index
Biochemical model of blood glucose dynamics (0-180 min) accounting for fat, protein, and fiber buffering.
Blood Glucose Curve (0-180 min)
Biochemical model of blood glucose dynamics (0-180 min) accounting for fat, protein, and fiber buffering.
Glycemic Load (GL) combines both the Glycemic Index (GI) and the actual amount of digestible carbohydrates in a serving.
Clinical thresholds: Low ≤ 10 pts • Moderate 11–19 pts • High ≥ 20 pts